

STORM MODEWeather tracking workspace
Agency warning geometry · no observed imagery displayed
Map
- Flood Warning 4
NWS’s polygons as issued, or the zones a zone-issued alert names; SPC’s watches by their counties. Checked . Data: NOAA/NWS, NOAA/SPC.
ⓘ About this map
Outlines: NOAA/NWS · Radar cells: IEM/NEXRAD. Outlines are warned areas, not storm paths.
Keys: R radar · V velocity · S satellite · O off · F fit area · L layers
Interactive imagery loads separately. Missing radar does not remove warnings or imply clear weather.
Recorded weather · gaps are marked. Coverage begins with recording activation.
Live sources keep independent clocks.
Replay coverage and interpretation
Rolling target: 24 hours; cells: six hours. Radar: NOAA MRMS national overview, 8-minute tolerance. Satellite: original GOES GeoColor day/night picture, hourly sampling, 75-minute tolerance. No interpolation or latest-image fallback. Warning and source checks retain their own clocks. “Recorded by” is collector acquisition evidence, not exact browser publication history.
Current GLM density, velocity and specialist layers are hidden during replay. Snow uses retained footprint metadata with unverified pixel time. Forecast uses one pinned issuance/run and exact valid time.
No observed replay frame displayed.
Open the complete replay reader (works without scripting or WebGL)Analysis and guidance
Choose product
Current weather
ReportsAnalysis and guidanceRadarObservations
Coastal observationsRadar-derived cellsStations and river gaugesRain and flooding
Flash-flood risk, Day 1River gauges in floodRain expected and rain that fellAll products · 3 more
Severe storms
SPC Day 1 outlookWatchesMesoscale discussionsNo product matches. Try a hazard or source name.
Analysis
Area, source times and interpretation
Current cached context, independently dated. Regional reference: TX; a reference within a wider monitoring area does not replace the complete warning geography. This section remains separate from the historical replay cursor and official cyclone forecast. Use Forecast to pin a retained model package.
Soundings: what weather balloons measured
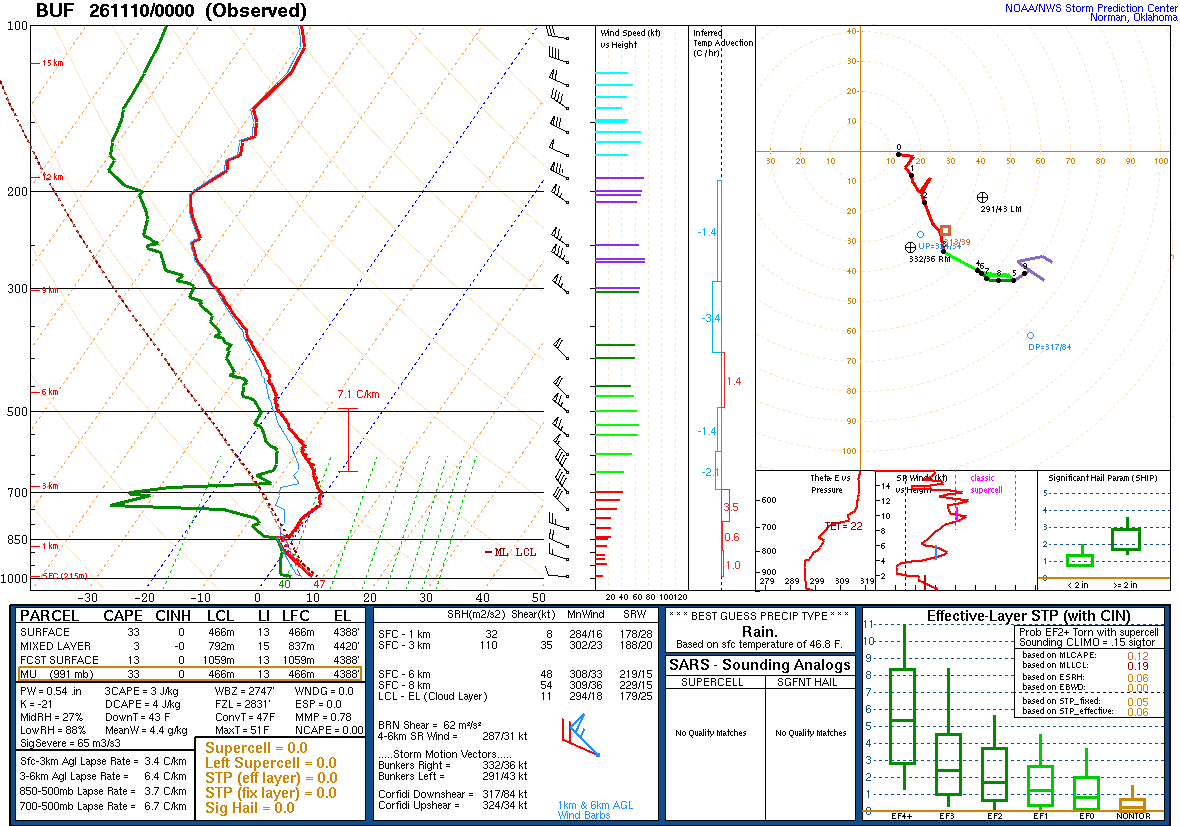
A balloon launched about an hour before the time named, measuring as it rose and drifted with the wind: the atmosphere above one place, at one time. Model soundings, which are forecasts, are not shown here.
The levels this sounding was drawn from (58)
| Pressure | Height | Temperature | Dew point | Wind |
|---|---|---|---|---|
| 991 mb | 215 m | 8.2 | 4.5 | 275° 13 kt |
| 945 mb | 610 m | 4.4 | 1.1 | 275° 18 kt |
| 925 mb | 782 m | 2.8 | 0.5 | 290° 16 kt |
| 910 mb | 914 m | 1.5 | 0.1 | 290° 16 kt |
| 895 mb | 1048 m | 0.2 | -0.2 | — |
| 876 mb | 1219 m | -0.9 | -1.2 | 295° 19 kt |
| 850 mb | 1459 m | -2.5 | -2.5 | 300° 20 kt |
| 840 mb | 1553 m | -0.7 | -5.1 | — |
| 811 mb | 1829 m | -0.7 | -7.9 | 290° 25 kt |
| 797 mb | 1973 m | -0.7 | -7.7 | — |
| 781 mb | 2134 m | -0.9 | -8.8 | 305° 25 kt |
| 752 mb | 2437 m | 0.2 | -15.8 | — |
| 738 mb | 2588 m | 0.8 | -36.2 | — |
| 724 mb | 2743 m | 0.1 | -33.4 | 315° 38 kt |
| 710 mb | 2898 m | -0.5 | -30.5 | — |
| 700 mb | 3011 m | -0.5 | -34.5 | 320° 43 kt |
| 685 mb | 3184 m | -1.9 | -27.9 | — |
| 673 mb | 3324 m | -2.5 | -10.5 | — |
| 653 mb | 3563 m | -4.1 | -14.1 | — |
| 639 mb | 3734 m | -4.7 | -11.7 | — |
| 624 mb | 3921 m | -5.9 | -11.9 | — |
| 597 mb | 4267 m | -8.4 | -13.1 | 315° 57 kt |
| 581 mb | 4477 m | -9.5 | -14.5 | — |
| 563 mb | 4720 m | -10.9 | -16.9 | — |
| 552 mb | 4877 m | -12.3 | -17.8 | 310° 65 kt |
| 533 mb | 5138 m | -14.5 | -19.2 | — |
| 500 mb | 5620 m | -18.1 | -21.2 | 310° 64 kt |
| 478 mb | 5954 m | -20.1 | -23.8 | — |
| 450 mb | 6401 m | -22.4 | -27.5 | 315° 55 kt |
| 436 mb | 6628 m | -23.9 | -28.5 | — |
| 424 mb | 6831 m | -24.9 | -30.9 | — |
| 402 mb | 7214 m | -27.7 | -33.7 | — |
| 400 mb | 7250 m | -27.9 | -33.9 | 315° 60 kt |
| 387 mb | 7487 m | -29.9 | -34.5 | — |
| 375 mb | 7710 m | -31.5 | -36.3 | — |
| 365 mb | 7901 m | -32.9 | -38.9 | — |
| 354 mb | 8116 m | -34.3 | -39.3 | — |
| 343 mb | 8336 m | -36.3 | -41.3 | — |
| 320 mb | 8813 m | -40.5 | -45.4 | — |
| 305 mb | 9144 m | -43.3 | -48.3 | 310° 67 kt |
| 300 mb | 9250 m | -44.3 | -48.5 | 305° 69 kt |
| 289 mb | 9498 m | -46.5 | -52.5 | — |
| 278 mb | 9754 m | -48.7 | -55.7 | — |
| 266 mb | 10041 m | -51.5 | -57.5 | — |
| 253 mb | 10364 m | -53.5 | -61.5 | — |
| 250 mb | 10440 m | -53.9 | -61.9 | 305° 66 kt |
| 240 mb | 10704 m | -53.9 | -63.9 | — |
| 225 mb | 11117 m | -57.1 | -65.1 | — |
| 209 mb | 11582 m | -59.6 | -68.2 | 305° 64 kt |
| 200 mb | 11860 m | -60.5 | -69.5 | 300° 71 kt |
| 190 mb | 12192 m | -58.5 | -75.5 | 300° 74 kt |
| 176 mb | 12662 m | -58.3 | -78.3 | — |
| 163 mb | 13145 m | -58.0 | -81.0 | 300° 70 kt |
| 150 mb | 13670 m | -57.9 | -81.9 | 315° 45 kt |
| 135 mb | 14326 m | -59.4 | -83.4 | 290° 49 kt |
| 123 mb | 14935 m | -58.0 | -83.9 | 305° 50 kt |
| 110 mb | 15616 m | -58.7 | -84.7 | — |
| 100 mb | 16210 m | -61.9 | -85.9 | 285° 38 kt |
Every station with a sounding (76)
- Aberdeen, SD (ABR)
- ADN
- Albany, NY (ALB)
- Albuquerque, NM (ABQ)
- Amarillo, TX (AMA)
- Birmingham, AL (BMX)
- Bismarck, ND (BIS)
- Blacksburg, VA (RNK)
- Boise, ID (BOI)
- Brownsville, TX (BRO)
- Buffalo, NY (BUF)
- Cape Canaveral, FL (XMR)
- Caribou, ME (CAR)
- Chanhassen, MN (MPX)
- Charleston, SC (CHS)
- Chihuahua, Mexico (76225)
- Corpus Christi, TX (CRP)
- Davenport, IA (DVN)
- Del Rio, TX (DRT)
- Dodge City, KS (DDC)
- Elko, NV (LKN)
- Flagstaff, AZ (FGZ)
- Fort Worth, TX (FWD)
- Gaylord, MI (APX)
- Glasgow, MT (GGW)
- Grand Junction, CO (GJT)
- Gray, ME (GYX)
- GRB
- Great Falls, MT (TFX)
- Greensboro, NC (GSO)
- International Falls, MN (INL)
- Jackson, MS (JAN)
- Jacksonville, FL (JAX)
- Key West, FL (KEY)
- La Paz, Mexico (76405)
- Lake Charles, LA (LCH)
- Lamont, OK (LMN)
- Las Vegas, NV (VEF)
- Lincoln, IL (ILX)
- Little Rock, AR (LZK)
- Maniwaki, Quebec (WMW)
- Mazatlán, Mexico (76458)
- Medford, OR (MFR)
- Miami, FL (MFL)
- Midland, TX (MAF)
- Nashville, TN (BNA)
- Newport, NC (MHX)
- Norman, OK (OUN)
- North Platte, NE (LBF)
- Oakland, CA (OAK)
- OYU
- Peachtree City, GA (FFC)
- Pickle Lake, Ontario (WPL)
- Pittsburgh, PA (PIT)
- Quillayute, WA (UIL)
- Rapid City, SD (UNR)
- Reno, NV (REV)
- Riverton, WY (RIW)
- Salem, OR (SLE)
- Salt Lake City, UT (SLC)
- San Diego, CA (NKX)
- Santa Teresa, NM (EPZ)
- Shreveport, LA (SHV)
- Slidell, LA (LIX)
- Spokane, WA (OTX)
- Springfield, MO (SGF)
- Sterling, VA (IAD)
- Tampa Bay, FL (TBW)
- Topeka, KS (TOP)
- Upton, NY (OKX)
- Valley, NE (OAX)
- Vandenberg, CA (VBG)
- White Lake, MI (DTX)
- Wilmington, OH (ILN)
- Yarmouth, Nova Scotia (YQI)
- Zacatecas, Mexico (76526)
SPC observed soundings checked · Data: NOAA/SPC
Radar-derived cells (28) · current
Collector checked ; feed generated . Zero cells does not establish coverage or clear weather. Observations from different radars are not merged.
- CRP / A1 · scan 2026-11-10T12:00:44Z · stale
- CRP / E5 · scan 2026-11-10T12:00:44Z · stale
- CRP / E9 · scan 2026-11-10T12:00:44Z · stale
- CRP / G2 · scan 2026-11-10T12:00:44Z · stale
- CRP / P5 · scan 2026-11-10T12:00:44Z · stale
- CRP / R1 · scan 2026-11-10T12:00:44Z · stale
- CRP / S6 · scan 2026-11-10T12:00:44Z · stale
- CRP / T1 · scan 2026-11-10T12:00:44Z · stale
- CRP / X8 · scan 2026-11-10T12:00:44Z · stale
- EWX / A3 · scan 2026-11-10T12:04:38Z · current
- EWX / D8 · scan 2026-11-10T12:04:38Z · current
- EWX / D9 · scan 2026-11-10T12:04:38Z · current
- EWX / L6 · scan 2026-11-10T12:04:38Z · current
- EWX / O0 · scan 2026-11-10T12:04:38Z · current
- EWX / P3 · scan 2026-11-10T12:04:38Z · current
- EWX / P4 · scan 2026-11-10T12:04:38Z · current
- EWX / Q3 · scan 2026-11-10T12:04:38Z · current
- EWX / R0 · scan 2026-11-10T12:04:38Z · current
- EWX / U1 · scan 2026-11-10T12:04:38Z · current
- GRK / A3 · scan 2026-11-10T12:06:20Z · current
- GRK / Q2 · scan 2026-11-10T12:06:20Z · current
- HGX / G0 · scan 2026-11-10T12:03:41Z · current
- HGX / L9 · scan 2026-11-10T12:03:41Z · current
- HGX / S0 · scan 2026-11-10T12:03:41Z · current
- HGX / W0 · scan 2026-11-10T12:03:41Z · current
- HGX / Y0 · scan 2026-11-10T12:03:41Z · current
- HGX / Y8 · scan 2026-11-10T12:03:41Z · current
- SHV / A1 · scan 2026-11-10T12:06:42Z · current
Station and river observations (157)
Surface source current; observed water-level source current. Each reading keeps its own time. Map markers show at most 500 stations and 500 gauges; the complete source directory is paginated.
Circle: surface station; square: water-level gauge. Filled: current reading and source; hollow: stale, unconfirmed or missing observation. Marker color is not a hazard category. Enable “Stations and gauges” in Layers to inspect them on the map.
- K0F2 · Surface station K0F2 · 56 °F (13.3 °C) · wind 0 kt · weather BR · current ·
- K11R · Surface station K11R · 57 °F (13.8 °C) · wind 0 kt · weather BR · current ·
- K2R9 · Surface station K2R9 · 59 °F (15 °C) · wind 7 kt · current ·
- K4F2 · Surface station K4F2 · 54 °F (12.2 °C) · wind 0 kt · weather BR · current ·
- K5C1 · Surface station K5C1 · 55 °F (13 °C) · wind 0 kt · current ·
- K5T9 · Surface station K5T9 · 61 °F (16 °C) · wind 0 kt · weather BR · current ·
- K66R · Surface station K66R · 58 °F (14.5 °C) · wind 0 kt · current ·
- K6P9 · Surface station K6P9 · 58 °F (14.6 °C) · wind 3 kt · current ·
- K6R3 · Surface station K6R3 · 57 °F (13.7 °C) · wind 0 kt · current ·
- K81R · Surface station K81R · 58 °F (14.6 °C) · wind 0 kt · weather BR · current ·
- K8T6 · Surface station K8T6 · 61 °F (16 °C) · wind 0 kt · weather -RA BR · current ·
- KACT · Surface station KACT · 60 °F (15.6 °C) · wind 4 kt · weather BR · current ·
- KADS · Surface station KADS · 63 °F (17 °C) · wind 0 kt · weather -RA · current ·
- KAFW · Surface station KAFW · 61 °F (16.1 °C) · wind 4 kt · current ·
- KALI · Surface station KALI · 60 °F (15.6 °C) · wind 8 kt · current ·
- KAMA · Surface station KAMA · 42 °F (5.6 °C) · wind 5 kt · current ·
- KAPY · Surface station KAPY · 62 °F (16.4 °C) · wind 5 kt · current ·
- KAQO · Surface station KAQO · 57 °F (14 °C) · wind 0 kt · weather BR · current ·
- KARM · Surface station KARM · 58 °F (14.6 °C) · wind 3 kt · current ·
- KAXH · Surface station KAXH · 59 °F (15.1 °C) · wind 0 kt · current ·
- KBAZ · Surface station KBAZ · 60 °F (15.6 °C) · wind 4 kt · current ·
- KBBD · Surface station KBBD · 57 °F (14 °C) · wind 4 kt · weather BR · current ·
- KBEA · Surface station KBEA · 58 °F (14.7 °C) · wind 6 kt · current ·
- KBGD · Surface station KBGD · 44 °F (6.7 °C) · wind 6 kt · current ·
- KBKD · Surface station KBKD · wind 0 kt · current ·
- KBMT · Surface station KBMT · 58 °F (14.6 °C) · wind 4 kt · current ·
- KBPG · Surface station KBPG · 54 °F (12.3 °C) · wind 7 kt · weather BR · current ·
- KBPT · Surface station KBPT · 61 °F (16.1 °C) · wind 6 kt · current ·
- KBRO · Surface station KBRO · 69 °F (20.6 °C) · wind 8 kt · weather -RA BR · current ·
- KCDS · Surface station KCDS · 51 °F (10.6 °C) · wind 5 kt · weather BR · current ·
- KCFD · Surface station KCFD · 60 °F (15.5 °C) · wind 0 kt · current ·
- KCLL · Surface station KCLL · 60 °F (15.6 °C) · wind 0 kt · current ·
- KCNW · Surface station KCNW · 59 °F (15 °C) · wind 0 kt · weather BR · current ·
- KCOM · Surface station KCOM · 59 °F (15.2 °C) · wind 4 kt · current ·
- KCOT · Surface station KCOT · 61 °F (16.1 °C) · wind 3 kt · weather BR · current ·
- KCRS · Surface station KCRS · 58 °F (14.4 °C) · wind 3 kt · weather BR · current ·
- KCVB · Surface station KCVB · 61 °F (16 °C) · wind 2 kt · current ·
- KCWC · Surface station KCWC · 57 °F (14 °C) · wind 6 kt · current ·
- KCXO · Surface station KCXO · 56 °F (13.3 °C) · wind 0 kt · current ·
- KCZT · Surface station KCZT · 61 °F (16 °C) · wind 0 kt · weather -RA · current ·
- KDAL · Surface station KDAL · 62 °F (16.7 °C) · wind 0 kt · current ·
- KDFW · Surface station KDFW · 61 °F (16.1 °C) · wind 3 kt · weather BR · current ·
- KDHT · Surface station KDHT · 39 °F (3.9 °C) · wind 8 kt · current ·
- KDTO · Surface station KDTO · 58 °F (14.4 °C) · wind 3 kt · current ·
- KDUX · Surface station KDUX · 39 °F (4 °C) · wind 9 kt · current ·
- KDWH · Surface station KDWH · 58 °F (14.4 °C) · wind 0 kt · weather BR · current ·
- KDYS · Surface station KDYS · 59 °F (15.2 °C) · wind 6 kt · current ·
- KDZB · Surface station KDZB · 59 °F (14.8 °C) · wind 0 kt · weather BR · current ·
- KE01 · Surface station KE01 · 54 °F (12 °C) · wind 7 kt · weather FG · current ·
- KE11 · Surface station KE11 · 51 °F (10.6 °C) · wind 0 kt · weather FG · current ·
- KE35 · Surface station KE35 · 44 °F (6.7 °C) · wind 3 kt · current ·
- KE38 · Surface station KE38 · 48 °F (8.9 °C) · wind 9 kt · current ·
- KE41 · Surface station KE41 · 55 °F (13 °C) · wind 4 kt · current ·
- KE42 · Surface station KE42 · 38 °F (3.5 °C) · wind 6 kt · current ·
- KE57 · Surface station KE57 · 45 °F (7 °C) · wind 0 kt · weather FG · current ·
- KEBG · Surface station KEBG · 63 °F (17 °C) · wind 9 kt · weather BR · current ·
- KEFD · Surface station KEFD · 61 °F (16 °C) · wind 0 kt · current ·
- KELA · Surface station KELA · 57 °F (14 °C) · wind 3 kt · current ·
- KERV · Surface station KERV · 57 °F (14 °C) · wind 0 kt · weather BR · current ·
- KETN · Surface station KETN · 58 °F (14.4 °C) · wind 3 kt · current ·
- KF00 · Surface station KF00 · 61 °F (16 °C) · wind 6 kt · current ·
- KF05 · Surface station KF05 · 58 °F (14.6 °C) · wind 8 kt · current ·
- KF44 · Surface station KF44 · 55 °F (13 °C) · wind 3 kt · current ·
- KF46 · Surface station KF46 · 61 °F (16.2 °C) · wind 0 kt · current ·
- KFTN · Surface station KFTN · 61 °F (16 °C) · wind 4 kt · weather BR · current ·
- KFTW · Surface station KFTW · 60 °F (15.6 °C) · wind 0 kt · weather BR · current ·
- KGDJ · Surface station KGDJ · 59 °F (15 °C) · wind 3 kt · weather BR · current ·
- KGGG · Surface station KGGG · 57 °F (13.9 °C) · wind 0 kt · current ·
- KGLE · Surface station KGLE · 56 °F (13.1 °C) · wind 0 kt · weather FG · current ·
- KGLS · Surface station KGLS · 63 °F (17.2 °C) · wind 9 kt · current ·
- KGNC · Surface station KGNC · 50 °F (10.1 °C) · wind 0 kt · weather FG · current ·
- KGOP · Surface station KGOP · 57 °F (14 °C) · wind 0 kt · weather BR · current ·
- KGPM · Surface station KGPM · 61 °F (16.1 °C) · wind 0 kt · current ·
- KGTU · Surface station KGTU · 61 °F (16.1 °C) · wind 0 kt · current ·
- KGVT · Surface station KGVT · 58 °F (14.7 °C) · wind 0 kt · current ·
- KGYB · Surface station KGYB · 59 °F (15.1 °C) · wind 0 kt · weather BR · current ·
- KGZN · Surface station KGZN · 57 °F (14 °C) · wind 5 kt · current ·
- KHDO · Surface station KHDO · 60 °F (15.6 °C) · wind 0 kt · current ·
- KHHF · Surface station KHHF · 37 °F (3 °C) · wind 2 kt · current ·
- KHOU · Surface station KHOU · 60 °F (15.6 °C) · wind 6 kt · current ·
- KHQZ · Surface station KHQZ · 59 °F (15.1 °C) · wind 0 kt · current ·
- KHRL · Surface station KHRL · 65 °F (18.3 °C) · wind 10 kt · weather -RA · current ·
- KHRX · Surface station KHRX · 43 °F (6.2 °C) · wind 5 kt · current ·
- KIAH · Surface station KIAH · 60 °F (15.6 °C) · wind 4 kt · current ·
- KINJ · Surface station KINJ · 60 °F (15.7 °C) · wind 0 kt · current ·
- KJAS · Surface station KJAS · 59 °F (15 °C) · wind 0 kt · current ·
- KJXI · Surface station KJXI · 57 °F (14 °C) · wind 0 kt · current ·
- KLBB · Surface station KLBB · 47 °F (8.3 °C) · wind 4 kt · weather BR · current ·
- KLHB · Surface station KLHB · 61 °F (16 °C) · wind 2 kt · weather BR · current ·
- KLLN · Surface station KLLN · 48 °F (9 °C) · wind 3 kt · weather FG · current ·
- KLRD · Surface station KLRD · 60 °F (15.6 °C) · wind 7 kt · weather -RA BR · current ·
- KLUD · Surface station KLUD · 61 °F (16 °C) · wind 4 kt · current ·
- KLUV · Surface station KLUV · 52 °F (11 °C) · wind 3 kt · weather FG · current ·
- KLVJ · Surface station KLVJ · 60 °F (15.6 °C) · wind 3 kt · current ·
- KLXY · Surface station KLXY · 57 °F (14 °C) · wind 0 kt · current ·
- KLZZ · Surface station KLZZ · 57 °F (14 °C) · wind 1 kt · weather BR · current ·
- KMCJ · Surface station KMCJ · 61 °F (16 °C) · wind 7 kt · current ·
- KMDD · Surface station KMDD · 53 °F (11.7 °C) · wind 5 kt · weather FG · current ·
- KMFE · Surface station KMFE · 64 °F (17.8 °C) · wind 8 kt · weather -RA BR · current ·
- KMKN · Surface station KMKN · 58 °F (14.7 °C) · current ·
Showing 100 of 157 listed sources. All surface stations and retained trends · All supported gauges and forecasts
About this monitored event
This event, as this site’s operators set it up
- Kind
- Severe weather
- Window
- Open: no start or end was set
- Updated
Spotlight
8 products · choose oneRiver gauges in flood
Rain expected and rain that fell
SPC Day 1 outlook
Watches
Mesoscale discussions
Storm ingredients
Radar
Monitoring area details
- Area
- Texas (NWS states: TX)
- Hazards
- Tornado, severe thunderstorm, flash flood, river flood, areal flood, coastal flood and other warnings, watches and advisories, and the forecasts for them
- Window
- In force now, with the next days of SPC’s and WPC’s products
- Made by
- This site’s operators, in its admin console. Nothing about a reader is stored. Watch another area
An area the operators chose, not a storm’s footprint: everything here is in force in this area, never “from this event”.
Alerts in this area 4
- Flood Warning4until 11 Nov 12:00Z
Every alert is in the alert list. Checked .
My places
Places saved on this device appear here with scripting enabled.
Alerts in this area
Area briefPeek view · alerts checked 12:11Z