

Forecast track

The official forecast track, drawn by this site from JTWC’s Warning 15 (). Not an official JTWC product. Data: JTWC. JTWC’s own.
Current advisory context · Typhoon 109 mph (95 kt) · ENE at 13 mph (11 kt)
JTWC Warning 15 ·
Latest advisory
Observed imagery loads separately from the advisory. The base map is not observed satellite imagery.
JTWC does not publish an NHC cone.
Basemap
MaverickWX map · Data: JTWC · not an official graphic
Recorded weather · gaps are marked. Coverage begins with recording activation.
Live sources keep independent clocks.
Rolling target: 24 hours; cells: six hours. Radar: NOAA MRMS national overview, 8-minute tolerance. Satellite: original GOES GeoColor day/night picture, hourly sampling, 75-minute tolerance. No interpolation or latest-image fallback. Warning and source checks retain their own clocks. “Recorded by” is collector acquisition evidence, not exact browser publication history.
Current GLM density, velocity and specialist layers are hidden during replay. Snow uses retained footprint metadata with unverified pixel time. Forecast uses one pinned issuance/run and exact valid time.
No observed replay frame displayed.
Open the complete replay reader (works without scripting or WebGL)Choose Forecast for a pinned issuance and valid time.
No product matches. Try a hazard or source name.
Current cached context, independently dated. Regional products keep their published footprint; they are not clipped or attributed to one storm. This section remains separate from the historical replay cursor and official cyclone forecast. Use Forecast to pin a retained model package.
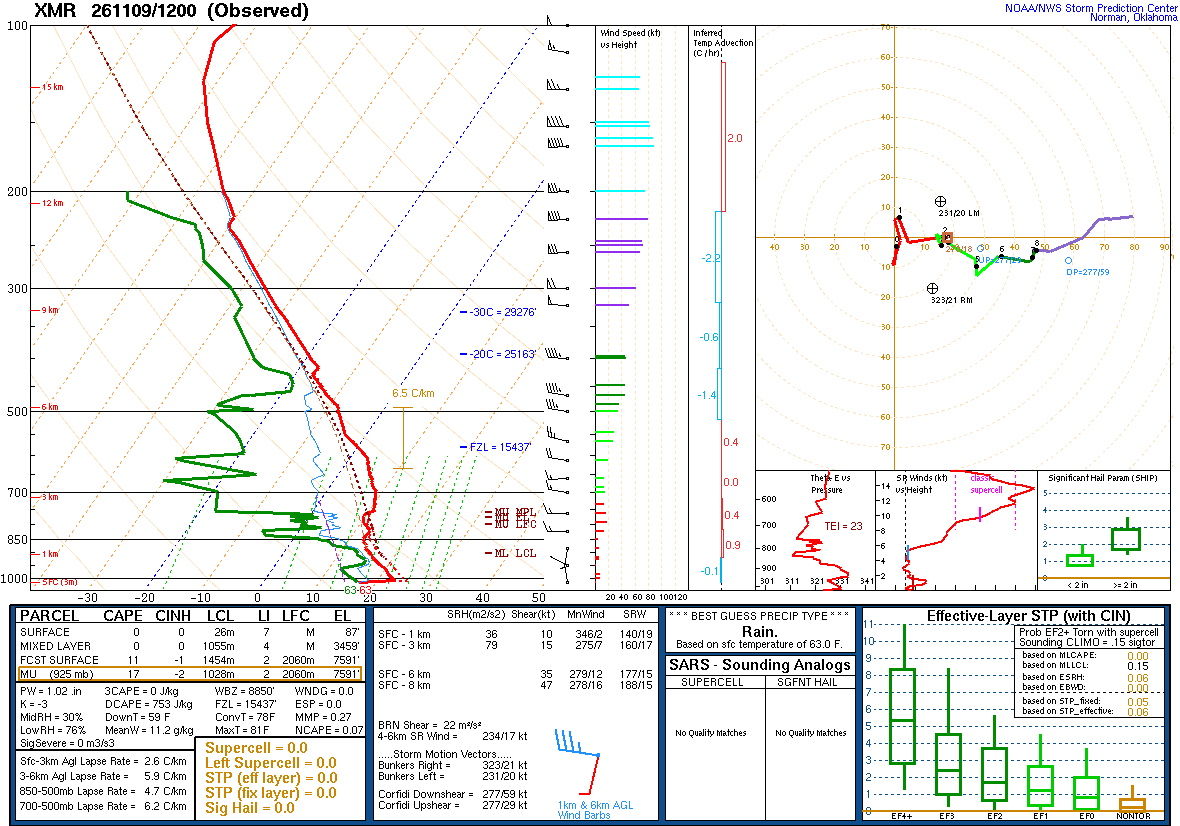
A balloon launched about an hour before the time named, measuring as it rose and drifted with the wind: the atmosphere above one place, at one time. Model soundings, which are forecasts, are not shown here.
| Pressure | Height | Temperature | Dew point | Wind |
|---|---|---|---|---|
| 1017 mb | 3 m | 17.2 | 17.0 | 350° 3 kt |
| 1000 mb | 153 m | 22.6 | 15.6 | 000° 9 kt |
| 983 mb | 305 m | 21.5 | 14.1 | 005° 9 kt |
| 962 mb | 489 m | 20.2 | 12.2 | — |
| 949 mb | 610 m | 19.0 | 14.7 | 300° 2 kt |
| 925 mb | 827 m | 17.2 | 15.6 | 180° 6 kt |
| 906 mb | 1004 m | 16.0 | 13.4 | — |
| 884 mb | 1213 m | 14.2 | 12.0 | — |
| 874 mb | 1309 m | 14.0 | 8.0 | — |
| 859 mb | 1455 m | 13.0 | 7.0 | — |
| 850 mb | 1544 m | 12.8 | 4.8 | 290° 5 kt |
| 837 mb | 1674 m | 12.8 | -5.2 | — |
| 822 mb | 1829 m | 12.8 | -6.0 | 270° 15 kt |
| 810 mb | 1949 m | 11.8 | 3.8 | — |
| 796 mb | 2095 m | 10.8 | 0.8 | — |
| 775 mb | 2317 m | 10.0 | 2.0 | — |
| 764 mb | 2438 m | 10.0 | -4.2 | 270° 17 kt |
| 736 mb | 2743 m | 10.3 | -17.7 | 280° 15 kt |
| 700 mb | 3163 m | 9.0 | -19.0 | 280° 16 kt |
| 684 mb | 3353 m | 8.1 | -22.8 | 270° 14 kt |
| 670 mb | 3525 m | 7.0 | -27.0 | — |
| 659 mb | 3658 m | 6.5 | -23.6 | 265° 14 kt |
| 648 mb | 3799 m | 5.8 | -14.2 | — |
| 615 mb | 4225 m | 3.8 | -28.2 | — |
| 596 mb | 4479 m | 2.0 | -19.0 | — |
| 567 mb | 4877 m | -1.4 | -21.2 | 285° 28 kt |
| 549 mb | 5136 m | -3.7 | -22.7 | — |
| 506 mb | 5777 m | -7.1 | -29.1 | — |
| 500 mb | 5870 m | -7.7 | -30.7 | 280° 35 kt |
| 488 mb | 6058 m | -8.5 | -29.5 | — |
| 468 mb | 6379 m | -11.5 | -26.5 | — |
| 448 mb | 6706 m | -14.1 | -18.9 | 280° 46 kt |
| 428 mb | 7055 m | -16.7 | -20.9 | — |
| 416 mb | 7268 m | -16.5 | -26.5 | — |
| 400 mb | 7560 m | -19.1 | -29.1 | 275° 47 kt |
| 338 mb | 8789 m | -28.7 | -37.7 | — |
| 323 mb | 9112 m | -31.7 | -37.7 | — |
| 300 mb | 9630 m | -35.7 | -41.7 | 270° 63 kt |
| 266 mb | 10460 m | -42.1 | -50.1 | — |
| 250 mb | 10880 m | -45.3 | -52.3 | 265° 72 kt |
| 238 mb | 11205 m | -48.3 | -54.3 | — |
| 225 mb | 11582 m | -50.1 | -59.7 | 265° 80 kt |
| 208 mb | 12079 m | -53.1 | -71.1 | — |
| 200 mb | 12330 m | -55.1 | -72.1 | 265° 75 kt |
| 166 mb | 13500 m | -62.5 | — | 265° 89 kt |
| 152 mb | 14021 m | -65.9 | — | 270° 84 kt |
| 150 mb | 14120 m | -66.5 | — | 275° 81 kt |
| 131 mb | 14935 m | -71.2 | — | 270° 67 kt |
| 112 mb | 15850 m | -74.5 | — | 280° 56 kt |
| 100 mb | 16520 m | -73.9 | — | 270° 49 kt |
| 87 mb | 17334 m | -76.5 | — | — |
| 75 mb | 18182 m | -69.7 | — | — |
| 59 mb | 19630 m | -66.9 | — | — |
| 47 mb | 20933 m | -65.9 | — | — |
| 37 mb | 22492 m | -64.7 | — | — |
| 23 mb | 25318 m | -51.7 | — | — |
| 13 mb | 29372 m | -40.1 | — | — |
| 11 mb | 30534 m | -40.9 | — | — |
SPC observed soundings checked · Data: NOAA/SPC
JTWC Warning 15 · advisory · forecast cycle . Forecast positions are future estimates, not observed imagery. Classification is shown only where published.
| Valid time / lead | Position | Classification | Sustained wind |
|---|---|---|---|
+12 h from forecast cycle | 25.5°N, 139.7°E | Typhoon | 109 mph (95 kt) |
+24 h from forecast cycle | 26.6°N, 143.7°E | Typhoon | 98 mph (85 kt) |
+36 h from forecast cycle | 28.0°N, 148.5°E | Typhoon | 81 mph (70 kt) |
+48 h from forecast cycle | 29.0°N, 153.4°E | Tropical storm | 63 mph (55 kt) |
+60 h from forecast cycle | 29.2°N, 157.5°E | Tropical storm | 52 mph (45 kt) |
Each entry selects one immutable snapshot. Intermediate, special and corrected records are separate identities where retained. Current NWS context is labelled separately. Historical impact manifests are not retained by this index; newer impacts are never attached to an earlier advisory. Same-time corrections replaced in the publisher’s index cannot be selected unless still listed.
| Official issuance | Revision kind | Record |
|---|---|---|
| JTWC Warning 15 · | advisory | Snapshot c752b70f · Selected |
| JTWC Warning 14 · | advisory | Snapshot 311990a5 |
| JTWC Warning 13 · | advisory | Snapshot 07c0ce17 |
| JTWC Warning 12 · | advisory | Snapshot 5bfaa1fd |
| JTWC Warning 11 · | advisory | Snapshot 2246b2a9 |
| JTWC Warning 10 · | advisory | Snapshot d2af0300 |
| JTWC Warning 9 · | advisory | Snapshot d9150cf8 |
| JTWC Warning 8 · | advisory | Snapshot 70a99d6f |
| JTWC Warning 7 · | advisory | Snapshot 8017732a |
| JTWC Warning 6 · | advisory | Snapshot 1d3d7ebb |
| JTWC Warning 5 · | advisory | Snapshot 70f8e842 |
| JTWC Warning 4 · | advisory | Snapshot f9baa0bb |
| JTWC Warning 3 · | advisory | Snapshot dd0679d9 |
| JTWC Warning 2 · | advisory | Snapshot 6bf2dbf6 |
| JTWC Warning 1 · | first | Snapshot 858bb03c |
The storm’s area, by its warning centre’s products: everything listed is in force in this area, never “from this storm”.
The official forecast track, drawn by this site from JTWC’s Warning 15 (). Not an official JTWC product. Data: JTWC. JTWC’s own.

The official intensity forecast, drawn by this site from JTWC’s Warning 15 (). Not an official JTWC product. Data: JTWC. JTWC’s own.
The storm’s page shows it on NASA GIBS (NOAA GOES, JMA Himawari)’s imagery, loaded by your browser. Himawari at 4° from the storm's meridian.
Imagery from NASA GIBS: NOAA GOES and JMA Himawari.

The models’ tracks, which are not a forecast, drawn by this site from JTWC’s Warning 15 (). Not an official JTWC product. Data: JTWC. JTWC’s own.
NOAA’s radar for the area, loaded by your browser as on the Radar page.
Drawn live: if the radar fails, nothing older is shown in its place.
Saved places are read from this device after scripting starts.
Search stays in this browser. A town point is not an address; no address-level surge is calculated.